

An interactive map shows how many car crimes have been reported across east London.
A tool created by Co-op Insurance, which can be found through this link, has revealed the number of vehicle crimes in any area - and what roads it is happening in the most.
Vehicle crimes is a broad term, but it can be anything from vehicle theft, theft from a vehicle and vandalism.
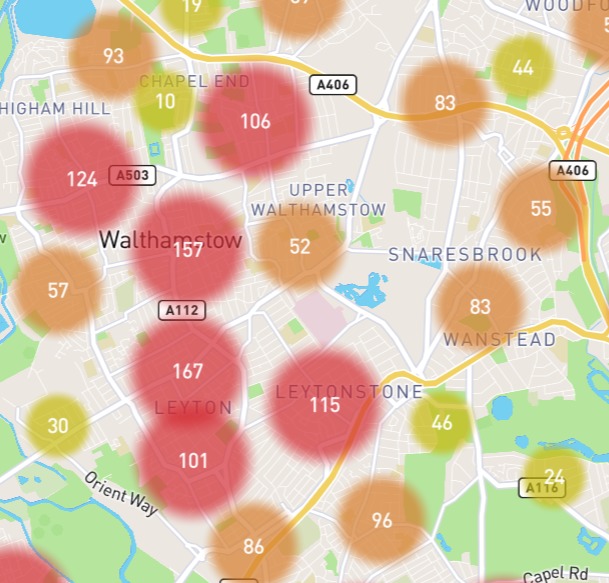
Red circles illustrate a high concentration of reported vehicle crimes.
How does the tool work?
The interactive map uses data published by the Home Office covering July 2020 to December 2020.
Users can search crime rates in their area by entering a postcode or location into the search bar.
The results are displayed in three coloured circles: red indicates an area that has had six or more incidents, orange shows streets that have seen three to five car crimes and yellow means there have been between zero and two incidents.
If you're planning on travelling further afield, the data spans across England and Wales.
A broad look at east London shows varying results, with Walthamstow, Higham Hill, Leyton, Newbury Park and Ilford areas reporting high vehicle crime.
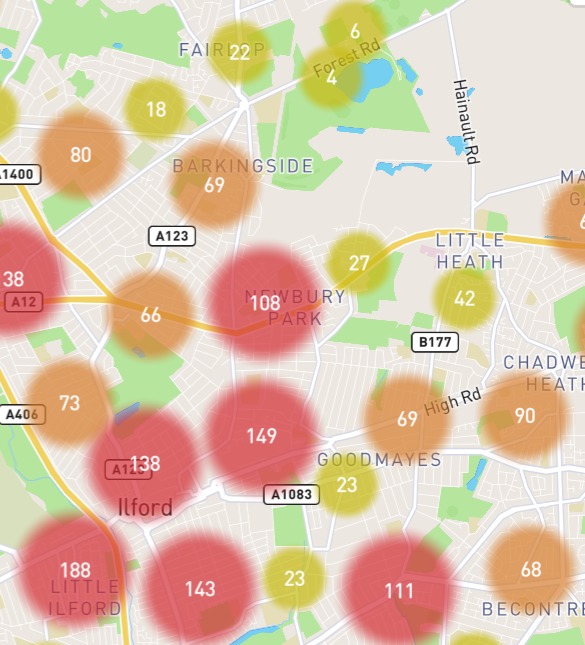
Red circles illustrate a high concentration of reported vehicle crimes.

For more breaking news, local headlines and features, ‘like’ our Facebook page.
We also have a Twitter account: @ELondonGuardian
Follow us to keep up-to-date with news in Waltham Forest and Redbridge.


Comments: Our rules
We want our comments to be a lively and valuable part of our community - a place where readers can debate and engage with the most important local issues. The ability to comment on our stories is a privilege, not a right, however, and that privilege may be withdrawn if it is abused or misused.
Please report any comments that break our rules.
Read the rules here